This module is where the captures become a result: a standardized number, an honest estimate of how much that number can be trusted, and a statement of what it can and cannot say. It is the analysis half of the survey, and it is what makes the data worth keeping.
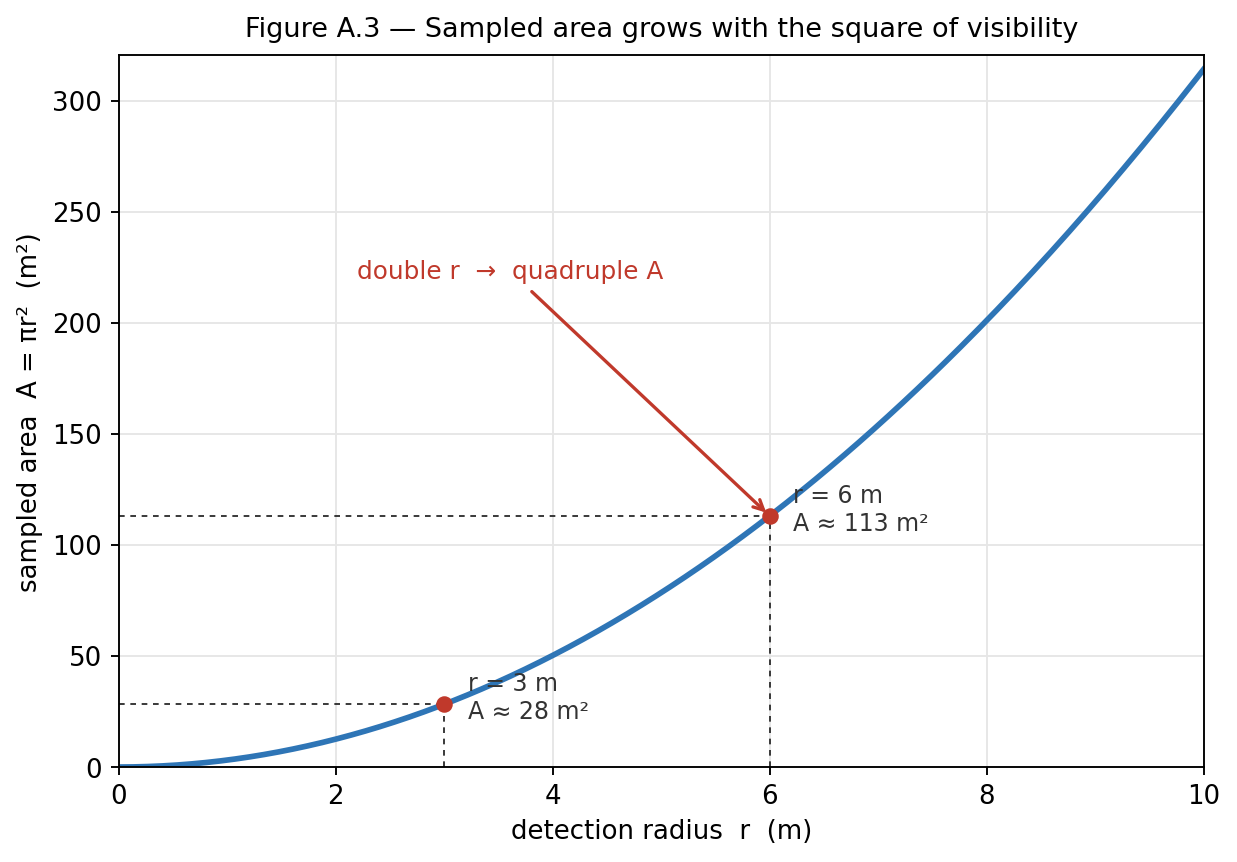
From a count to a density. Each capture gives a count of reef-associated organisms, N. On its own that count is not comparable to any other, because it depends on how much area was in view. So it is divided by the area the capture sampled — the disk of radius r — to give an areal density: the count standardized to the area actually seen (Appendix A.3). Because the area grows with the square of the radius, this division is what removes the visibility effect: the same place yields a bigger count on a clear day but, divided by the bigger area, the same density. The survey's reading for a hub is the average of the six captures' densities — the densities averaged, never the counts pooled over a summed area.
Comparing across dives — cancelling the kick-length. A kick cycle is not a fixed distance; it changes with the day's gear, current, and the diver. So a density built from raw kick counts would drift between dives even on an unchanged reef. The survey removes this by expressing the result through the ratio r/K — visibility-kicks over calibration-kicks — both measured on the same swim, so the day's kick-length cancels (Appendix A.7). What is compared across dives is a number that no longer depends on how far a kick happened to carry that day.
The noise floor — the smallest change the survey can trust. This is the most important idea in the analysis, and the reason Dive 3 exists. Re-survey the same hub on an unchanged reef and the reading will not come back exactly the same — counting, sampling, small navigation drift, the resident fish milling, and any difference in conditions all move it a little. That spread — measured by re-occupying a hub and re-running the ring (Dive 3, and again on Dive 4) — is the survey's noise floor: the range of readings you get from repeated surveys under comparable conditions when nothing real has changed at the reef. It is not pure instrument error; it bundles observer, navigation, environmental, and short-term biological variability together, which is why it is the honest yardstick. It is the single most useful thing the survey can know about itself, because it sets the rule for reading every future result: a later reading counts as real change only if it moves by more than the noise floor — the noise floor is the minimum change the survey can detect. A baseline is therefore not one number but a mean and a spread, and change is judged against the spread.
The uncertainty budget. Every result carries a short, plain-language account of what limits it: where the hub is (consumer-grade GPS, a few meters — which affects re-finding the place, not the count); the conspicuousness limit, which is the headline term; the two-observer counting spread; the error in r, which enters the density roughly doubled because the area depends on the radius squared — a 10% error in the radius is about a 20% error in the density, which is why the Dive 1 calibration is worth doing carefully; and representativeness, where a hub's reading is taken to stand for a wider area. Section Four gives the statement a demographer fills in; Appendix A.6 gives the budget in full.
The limitations statement, and the one principle. Every product the course produces ends with this budget, written so a reader can act on it. It is what makes the data trustworthy to anyone who later uses it — a number without its limits is a number that will be over-read. The principle that governs the whole analysis follows from the budget: claim the trend, state the budget — never claim the absolute population.
Carrying it forward — citizen science, by your choice. A single survey is a snapshot; the method's value grows when a place is surveyed again over seasons and years, each reading judged against the noise floor. Whether to carry a site forward into an ongoing record is the demographer's own choice — the course teaches the method, provides a station-log template (Section Nine) and the scoooba.com calculator (Section Four), and gives the reading rule (change beyond the noise floor). Where a demographer chooses to contribute, existing platforms are the home for the records: iNaturalist for species observations, and — for divers continuing within PADI's own conservation framework — PADI AWARE's Conservation Action Portal, which hosts citizen-science programs such as the AWARE Biodiversity Survey and Dive Against Debris. The course builds the skill and the discipline, not a parallel database.