What Bathymetry Is
Bathymetry is the underwater equivalent of topography: a map of how depth varies across a site. Your Deeper Smart Sonar Max produces bathymetric data by pinging acoustic pulses straight down at the bottom and timing how long the echo takes to come back. Each ping produces one data point: a depth measurement at one latitude/longitude position. As the unit drifts across the surface (towed by you, below), it produces a sparse cloud of (lat, lon, depth) points. The Fish Deeper app interpolates between those points to render a continuous 3D map.
The Sonar Footprint
A sonar pulse is not a line. It is a cone. The Deeper Max emits acoustic energy in a narrow beam of approximately 7°, a medium beam of 20°, or a wide beam of 47° depending on which mode you select. The cone widens as it travels downward; by the time it reaches the bottom, it covers a circle of measurable diameter. That circle is the footprint — the area the sonar actually measures with a single ping.
The diameter of the footprint, D, depends on the water depth (from float to bottom), d, and the beam angle, θ:
D = 2 d tan(θ / 2)
This is straight geometry. The cone has a half-angle of θ/2. Over a depth d, the half-base of the cone is d × tan(θ/2). The full diameter is twice that.
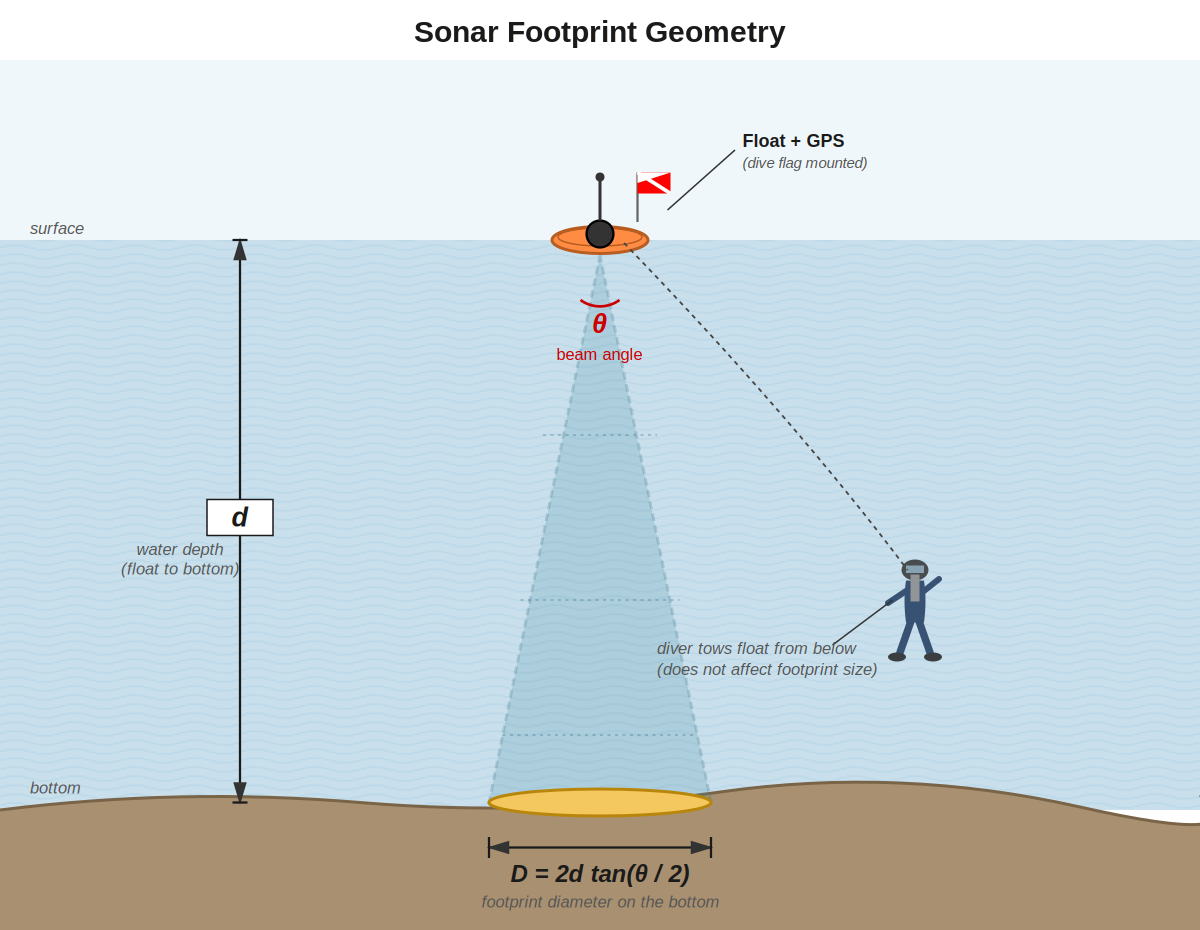
Figure 1. Sonar footprint geometry. Float on the surface; cone projects down through water depth d; footprint diameter D on the bottom. The diver positions the float but does not affect the geometry.
Worked Example
You are surveying a site with a bottom 60 ft below the surface. You select the narrow beam (7°) on your Deeper Max for the best resolution. What is the footprint diameter?
D = 2 × 60 × tan(3.5°)
D = 120 × 0.0612
D ≈ 7.34 ft
So each ping samples a circle about 7½ ft across on the bottom.
Why This Matters: Grid Spacing
To produce a map without gaps, the footprints from adjacent passes must overlap. Industry practice for recreational bathymetry is roughly 30% lateral overlap between adjacent grid lanes. The required spacing s between lanes is:
s = D × (1 − overlap fraction)
With D = 7.34 ft and 30% overlap:
s = 7.34 × 0.70 ≈ 5.14 ft
Round down (never up) to preserve the overlap margin: use 5 ft as your target lane spacing.
Try it online: the Footprint & Grid Spacing calculator in the Tools section at reefcartographer.com
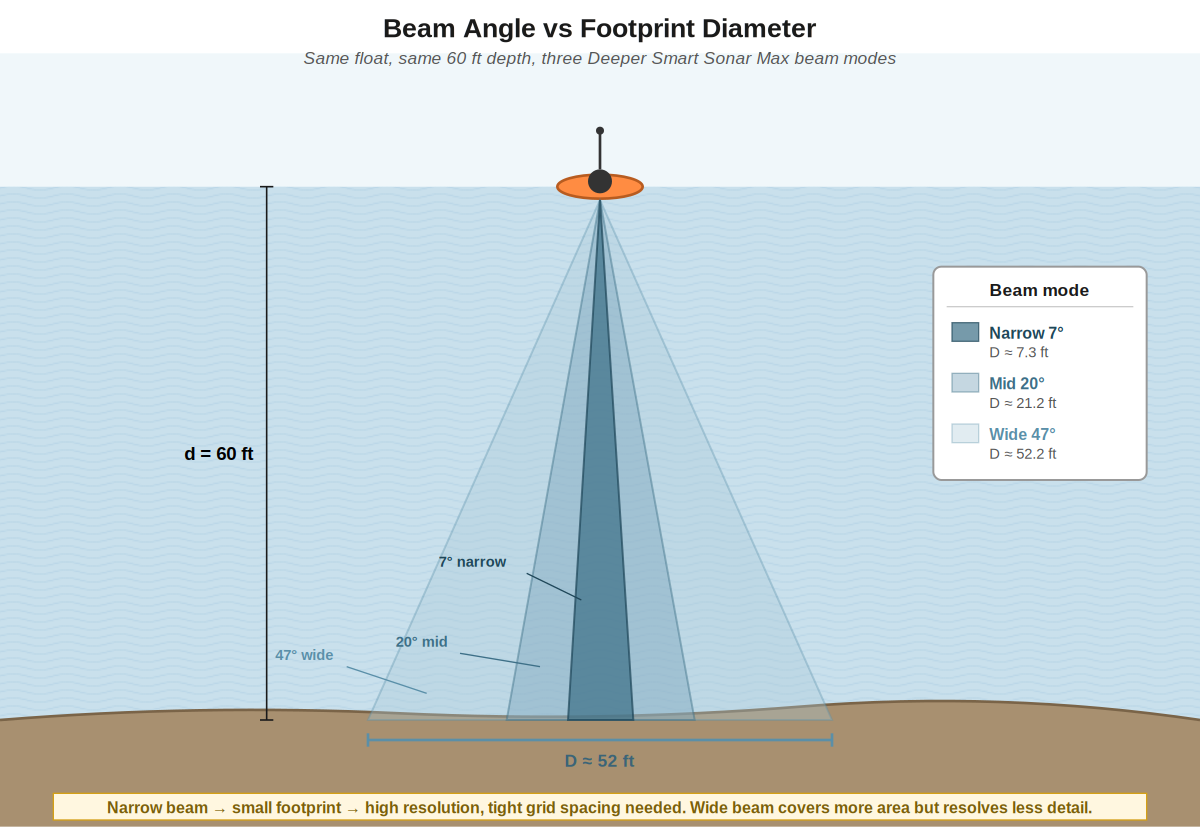
Figure 2. The same float at the same 60 ft depth produces dramatically different footprints depending on beam mode: 7 ft, 21 ft, or 52 ft.
Where the App Lives
The Fish Deeper app does not travel underwater with you. Two facts about the sonar's Wi-Fi link explain why, and both come straight from the manufacturer:
First, Wi-Fi does not travel through water. The sonar floats on the surface; the phone or tablet running the app has to stay at the surface too, close enough to keep the link.
Second, the sonar does not store the map onboard. It needs a live, continuous link the whole time you are surveying. If the link drops, that piece of the track is gone for good — there is no catching up later. That is why protecting the link matters so much, and why you repeat any lane where the link or GPS dropped.
The reliable range over water is roughly 30–50 m comfortably, 70–90 m in calm water, and up to about 120 m on a perfect day. Because of that, your team will use one of two setups, and your instructor will tell you which:
Configuration A — Topside Operator: the phone stays with the Surface Data Operator on shore or a boat, held up near the water for the best signal, while you tow the float within range. The operator watches your GPS lock and recording live and can call a repeat or an abort in real time.
Configuration B — Data Buoy: the phone rides in a sealed, see-through case mounted right on the float, moving with the sonar so the link never drops. Nobody can watch the screen mid-dive, so the team verifies everything before sealing the case and checks the data after surfacing. This is the setup for bigger areas or rougher water.
Either way, your job underwater is the same: tow the float on the planned path while maintaining buoyancy, heading, visual contact with your teammate, and line tension. You do not operate the app underwater.
If the team reports GPS loss, float submersion, or an obvious track gap, you may need to repeat that lane or abort the data run. Bad data is not fixed by pretending the gap did not happen.
Critical point The footprint depends on water depth (float to bottom), NOT on your diver depth. The cone projects from the surface float downward through the entire water column. Your job as the diver is to position the float horizontally over the survey area. The float does the acoustic work; you do the navigation. |
|---|
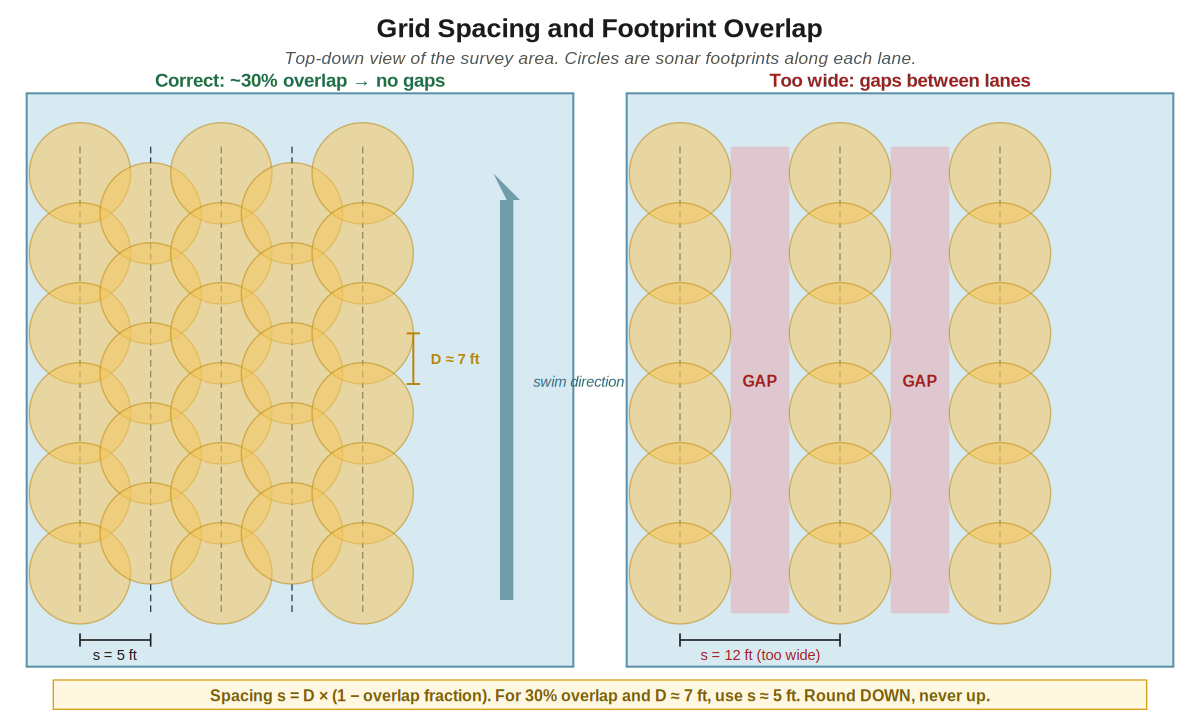
Figure 3. Grid spacing seen from above. Adjacent lanes must overlap (left) or you leave gaps in the coverage (right). The spacing rule: s = D × (1 − overlap fraction), rounded DOWN.
Self-Check
1. You are at a site where the bottom is at 40 ft. You select the medium beam (20°). What is the sonar footprint diameter?
2. If you want 30% lane overlap with that footprint, what is the required lane spacing?
3. Your teammate says "the footprint is smaller because we are diving deeper." Is this correct? Why or why not?
4. Where should the phone or tablet running Fish Deeper be during Dive 1, and what is the Surface Data Operator watching?
Answers
1. D = 2 × 40 × tan(10°) = 80 × 0.1763 ≈ 14.1 ft.
2. s = 14.1 × 0.70 ≈ 9.9 ft; round down to 9 or 10 ft for spacing.
3. No. The footprint depends on water depth (float to bottom), not the diver's depth. The diver might be at 30 ft below the surface and 10 ft above the bottom, but the cone projects from the surface and intersects the bottom — the diver's position is geometrically irrelevant to the footprint size.
4. The phone or tablet stays at the surface — either with the Surface Data Operator (Config A) or sealed on the data buoy (Config B) — because Wi-Fi does not travel through water and the sonar does not buffer data onboard. The team watches recording status, GPS lock, data continuity, and float submersion (live in Config A; via setup-and-seal verification plus post-dive check in Config B).
When the Sonar Lies: Limitations and Environmental Factors
Your sonar is good, but it has limits. Knowing when it produces bad data is part of producing an honest map. Watch for these:
-
Very shallow water. Depth readings get noisy and unreliable in very shallow water. This is one reason you map the reef itself with the camera, not the sonar.
-
Vegetation and soft bottoms. Dense weed, suspended algae, and soft or gassy mud can give false bottom returns — the sonar reads the top of the weed or mud instead of the real bottom. You will see this as noise or false structure when you clean the track.
-
Thermoclines. A sharp temperature layer can bounce the sound and show up as a false bottom. Strong thermoclines wreck depth data.
-
Waves. Chop pitches the float and can dunk the antenna. Past a certain sea state the data falls apart. Wave height is a go/no-go call.
-
Tow speed. Towing too fast or unevenly stretches and squashes your data along the track, distorting the shape of the bottom. Slow and steady wins.
-
GPS accuracy. Consumer GPS is good to only about 3–5 m, and worse when the antenna is low or wet. This sets the floor on how accurate your map can ever be — and it is why your map is recreational, not survey-grade.
-
No second chances on a dropped link. The sonar does not save data onboard. If the Wi-Fi link drops mid-survey, that section is simply gone — there is no recovering it later. Protect the link; repeat any lane where it dropped.