Learning Objectives
By the end of this knowledge development session, student divers will be able to:
- Describe how downwelling light diminishes with depth and name the coefficient that describes the rate.
- Explain why the ratio of two light readings is comparable between days while a single reading is not.
- Explain why the attenuation coefficient is computed from the shallowest and deepest logger rather than from adjacent pairs.
- State how the intermediate loggers are used to test whether the water column is optically uniform.
- Describe how thermal structure and optical structure are related, and what it means when one appears without the other.
- Explain why the logger's light sensor measures illuminance rather than the light used by photosynthesis, and state how the resulting coefficient must be labelled.
- Describe two ways a light record can be corrupted by how the instrument was mounted.
Presentation Notes
a. Light does not run out; it fades. Every metre of water removes a fixed fraction of the light passing through it, not a fixed amount. Ten feet down you might have three quarters of the surface light; another ten feet takes three quarters of what remains, not three quarters of the original. That is why light seems to disappear slowly at first and then quickly — and why a plot of light against depth curves rather than falling in a straight line.
b. Water removes light in two ways. Some is absorbed — taken up by the water itself and by dissolved colour, and turned into heat. Some is scattered — bounced off particles and sent in a different direction. A photodiode pointing at the sky cannot tell the two apart. It only reports how much light arrived.
c. The number that describes the fading is called Kd. In full, the diffuse attenuation coefficient for downwelling light. It bundles absorption and scattering together into a single figure: the fraction of light removed per metre of depth.
Its units are per metre, written m⁻¹, and a small value means clear water. A Kd of 0.05 m⁻¹ means each metre removes about five percent of the light reaching it — so ten metres down, roughly sixty percent of the surface light remains. A Kd of 0.5 m⁻¹ is turbid coastal water: ten metres down, less than one percent is left.
A useful way to hold it: one divided by Kd is the depth at which light falls to about a third of its surface value. At Kd = 0.05 that is 20 m; at Kd = 0.5 it is 2 m. Clear reef water typically falls somewhere between 0.03 and 0.1 m⁻¹, so a student diver computing a value far outside that range should check their arithmetic and their sensor mounting before believing it.
d. Kd is a property of the water, not of the day. This is the point that makes the measurement useful. The raw brightness at ten feet depends on the sun angle, the cloud, the sea state and the time of day, and it can easily vary by a factor of five between one morning and another. But Kd is derived from the ratio of two readings taken at the same moment, and whatever the surface light was, it appears in both. It cancels. Two Station Reports made in different weather are still comparable in Kd, and not comparable at all in raw brightness.
e. Never compare raw readings across days. Compare coefficients. This is the single most common error in light measurement, and it is worth saying plainly. "It was darker at twenty feet today" is usually a statement about the sky. "Kd was higher today" is a statement about the water. If you want to compare brightness between days you must know what the surface light was doing on both, which requires measuring it — and unless someone has put a logger at the surface, nobody did.
f. Use the shallowest and deepest logger to compute it. Over a short depth interval the light does not change much — across ten feet of clear water it may drop only about a seventh — and the light sensor itself carries an uncertainty of order ten percent uncalibrated — a planning figure; the intercomparison below replaces it with a measured value. Computing a coefficient from two readings that close together means the answer is nearly all instrument noise. Across the full span of the array the change is large enough to sit well clear of that noise. So: the endpoints give the number you report, whatever the number of loggers on the line.
The ratio cancels the sky, not the sensors. E₁ and Eₙ come from two different photodiodes, and if their gains differ the difference passes straight into Kd — the optical twin of the offset problem in Topic 3, where subtraction cancels an error only within one instrument. The dry session therefore includes a light intercomparison: all loggers side by side under the same sky, simultaneous readings, each channel's gain measured as its departure from the group — and the spread that remains is u(lnE), the light channel's measured single-reading uncertainty. Simultaneity does here what the ratio does for Kd: a passing cloud dims every sensor at the same moment and cancels. It also keeps the linearity test honest — an uncorrected gain on a middle logger would sit off the line looking exactly like a real layer.
g. Then use the intermediate loggers to check that the number means anything. The simple picture assumes the water is optically the same from top to bottom. If it is, and if you plot the readings the way the appendix describes, the points fall on a straight line. If a middle point sits off that line, the water is not uniform — there is a layer of something, cloudier or clearer, between the sensors. That is a finding, and it also warns you that a single Kd for the whole column is misleading. The array gives you a number and a test of the number.
h. Thermal and optical structure often appear at the same depth. A thermocline does not itself attenuate light — water absorbs almost the same at 24 °C as at 28 °C. But the stratification that sustains a thermocline also suppresses vertical mixing, so particles settle onto the density boundary and biological material accumulates there. The optical layer is a consequence of the same physical structure, not of the temperature.
This gives you two independent channels on the same instruments, testing the same assumption:
| Temperature profile | Light profile | Reading |
|---|---|---|
| step at a depth | kink at the same depth | real stratification, with material held at the boundary |
| step | no kink | a density boundary with no optical signature — possible, and worth noting |
| no step | kink | an optical layer with no thermal structure — a sediment plume, or a shaded or fouled sensor |
| neither | neither | uniform column; a single Kd is valid |
The third row is the one that catches mistakes. Light structure with no thermal counterpart should prompt you to check the instrument — was that logger shaded, was the photodiode fouled — before you report it as a property of the water.
i. Your sensor measures human light, not plant light. Photosynthesis uses a particular band of wavelengths, and scientific instruments built for that purpose measure exactly that band — photosynthetically active radiation, or PAR. The logger in this course measures illuminance — light weighted the way the human eye responds to it, brightest in the green and yellow, blind in the far red and violet. That is a different quantity. Water absorbs red strongly and blue weakly, so the two weightings give genuinely different attenuation coefficients.
j. So label it, and it stays honest. A Kd from these loggers is recorded in the Station Report as Kd(photopic) — the attenuation of light as a human eye weights it. It is a real, reproducible property of the water. It is not the coefficient a marine biologist would quote for light available to algae, and reporting it as though it were would be a false claim. There is a second reason to be pleased about this, which appears in Topic 7: the other optical measurement in this course is made with human eyes, so the two instruments share a weighting and can be compared directly.
k. Point the sensor at the sky. The photodiode has a face, and it measures light arriving on that face. A logger that has rotated on the line is measuring something other than downwelling light, and the reading is not recoverable. Unlike the temperature channel — which does not care which way the logger points — the light channel is entirely dependent on it. Mount each logger so it cannot spin.
l. And keep the shadows off it. A boat hull overhead, the mooring line itself, or a diver hovering above a logger for a few minutes will put a hole in the record that looks exactly like cloudy water. When planning the station, check that every logger has clear sky above it, and keep divers off the vertical above the array.
m. Sunlight itself is not steady. A passing cloud changes the surface light in seconds. Because Kd is a ratio of readings taken at the same instant, this mostly takes care of itself — but only if the readings really are simultaneous. This is another reason the clocks on all loggers must be synchronized before the dive, and a reason to prefer a period of steady conditions when selecting which part of the record to analyze.
n. What a change in Kd tells you. Higher Kd means light is being removed faster: more particles in suspension, more dissolved colour, or both. Over a reef the usual causes are sediment stirred up by waves or current, a plankton bloom, or runoff from land after rain. On its own Kd cannot distinguish these. Combined with the clarity measurement in Topic 6, it can begin to — and that combination is the subject of Topic 7.
Appendix reference. The definition of Kd, the exponential attenuation law it comes from, the endpoint calculation, the linearity test, and the propagation of sensor and depth uncertainty into the reported coefficient are given in full in the Technical Supplement, sections A.1 to A.3.
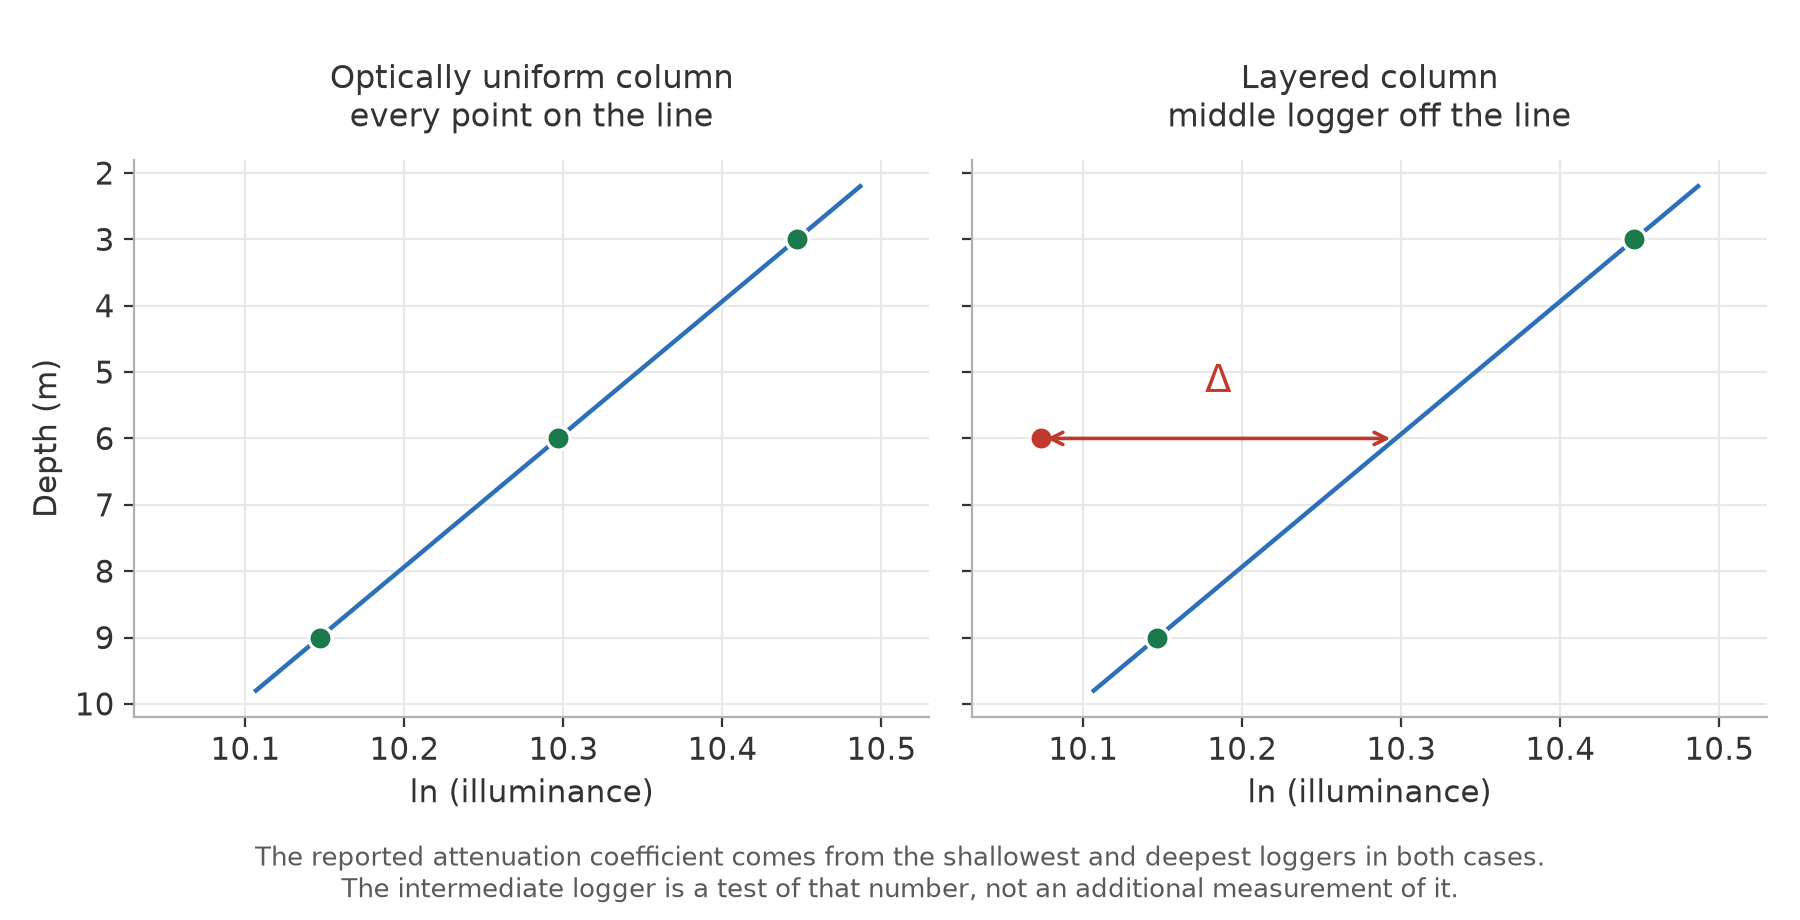
Left: an optically uniform column, where every logger falls on one straight line and the linearity test passes. Right: a layered column, where the middle logger sits off the line drawn between the endpoints. Both panels use the same endpoint loggers and therefore yield the same attenuation coefficient — the intermediate logger tests that number rather than contributing to it.